By: Susan Hagley, MST
Senior Wealth Strategist
There are many charitable giving vehicles available to help you carry out your philanthropic goals. In our previous e.Insight, we discussed one of the commonly used options to consider; a Donor Advised Fund. In this Part 2, we will discuss Private Foundations.
Basics
A Private Foundation is a distinct tax-exempt legal entity that is governed by its own set of bylaws to support charitable activities. Private Foundations have more required formalities and costs, but also allow for more flexibility and family control over grantmaking and investment decisions. Private Foundations can be a very powerful charitable tool to promote philanthropy through multiple generations.
Starting a Private Foundation is a more time-intensive process that includes filing an application with the state and IRS to obtain private foundation status. This involves legal and accounting costs to complete the application and filings prior to being approved.
Administration
Once established, Private Foundations typically hire staff or outside advisors to manage the administrative work and investment management for the Foundation. They can also appoint a board of directors (including family members) and are recommended to have regular board meetings, which include recording minutes.
In addition to the general laws that all charities must follow, Private Foundations are subject to complex technical rules. Failure to follow these rules, described below, may result in excise tax penalties:
Grantmaking
Private Foundations offer a wider array of choices in grantmaking compared to Donor Advised Funds (DAFs), which can only issue grants to 501(c)(3) charitable organizations. Private Foundations, for example, may also provide scholarships to individuals, grants to families or individuals for hardships and emergencies, and grants to international organizations. A Private Foundation can also make grants to a DAF or even be converted into a DAF, if specific rules are followed. On the contrary, a Donor Advised Fund can’t make grants to or be rolled into a Private Foundation. The Private Foundation is responsible for legal compliance and due diligence in the grantmaking process.
Privacy
Private Foundations are required to file annual returns, which are available to the public. These returns list foundation assets, contributors and grantees. Therefore, it is not possible to make anonymous gifts.
Contributions and Asset Selection
A Private Foundation can be funded with many different types of assets. For example, donors may gift cash, publicly-traded securities, mutual funds, publicly-traded bonds, art, real property and private equity investments. Unlike a DAF, where the sponsoring organization may limit the type of assets gifted and also usually sells after receiving, a Private Foundation has less restrictions.
One of the most appealing qualities of Private Foundations is the degree of flexibility around investment decisions. This allows Private Foundations to grow their assets in a tax-efficient and dynamic way. A Private Foundation can include private equities in its portfolio, as long as the board follows all of the specific IRS rules and is cognizant of other issues, including liquidity needs and unrelated business income tax. In addition, Private Foundations can invest in Program Related Investments (PRIs). A PRI is a versatile investment that is designed to provide a below-market return back to the Private Foundation, which can then be used for charitable purposes.
Family Engagement
Many donors start a Private Foundation with long-term family engagement in mind. Private Foundations are inherently collaborative because of the required board structure. The family can remain in control through generations by specifically drafting into the organizational documents that family members are to serve on the board of directors. A Private Foundation may hire and compensate family members to provide professional services to the Foundation, provided their compensation is reasonable. The high-level of formality and long-term platform provided by Private Foundations may be attractive to families that want to do something positive, together, for generations to come.
In addition to the board structure, donors may wish to create a Family Philanthropic Mission Statement to memorialize values, experiences and insights. A Family Philanthropic Mission Statement may provide guidelines for grantmaking such as specific causes and geographic areas. It will also ensure that your core vision will guide your family giving now and in the future.
Income Tax Deductions for Taxpayers Who Itemize Deductions
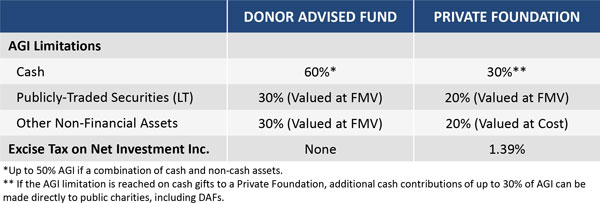
Private Foundations and DAFs are subject to different tax treatment. In Part 1, we compared the income tax deductions. Gifts to private foundations are subject to lower Adjusted Growth Income (AGI) limitations than gifts to a DAF. In addition, private foundations are subject to an annual excise tax of 1.39% on net investment income.
Conclusion
Donor Advised Funds and Private Foundations are commonly used charitable vehicles that may effectively help you reach your philanthropic goals. They offer very different levels of control, flexibility and legacy building. The choice between philanthropic vehicles also does not need to be an either/or decision. Donor Advised Funds can be a great complement to a Private Foundation. When used together, they can be an optimal solution for managing wealth and achieving philanthropic impact.
How do you decide what makes sense for your family? Here are some questions to discuss with your Oxford Advisors to help guide the decision:
The information contained in this report is confidential and proprietary to Oxford and is provided solely for use by Oxford clients and prospective clients. The opinions expressed are those of Oxford Financial Group, Ltd. The opinions are as of date of publication and are subject to change due to changes in the market or economic conditions and may not necessarily come to pass. The information in this presentation is for educational and illustrative purposes only and does not constitute investment, tax or legal advice. Tax and legal counsel should be engaged before taking any action. OFG-2401-38
By: Susan Hagley, MST
Senior Wealth Strategist
There are many charitable giving vehicles available to help you carry out your philanthropic goals. Two of the more commonly used options to consider are a Donor Advised Fund or a Private Foundation. Both will allow you the opportunity to be more strategic with your charitable giving and to create a philanthropic legacy for your future generations.
In this first email in our two-part series, we will discuss Donor Advised Funds. Understanding the distinct advantages and drawbacks is the key to deciding which vehicle is best suited for your circumstances and goals.
Basics
A Donor Advised Fund (DAF) is a giving account that is housed in a public charity (the sponsoring organization). Donor Advised Funds are a simple and efficient way to make a charitable impact. Donors may contribute assets and receive a current year income tax deduction. The funds can then be invested and grow tax-free while the donor has flexibility to recommend grants to charity over time. This provides families with time to develop a thoughtful giving plan.
Setting up a DAF involves selecting a sponsoring organization (such as a national nonprofit or a community foundation) and completing their requisite form or application. There is generally no cost involved in opening a DAF and it can typically be established and ready in a few days. Once the DAF account is open, the donor makes an irrevocable gift that cannot be returned or used for any purpose other than grantmaking to charities.
Administration
Once established, the sponsoring organization handles the administrative work at a low cost. This includes managing investments, record keeping, tax receipts and grant administration. The donor retains advisory privileges to make grant requests and, in some cases, select an investment advisor. Sponsoring organizations typically have suggested minimum payouts and limits on the length of time without any grants being made. They may also require a grant if the overall fund did not meet its total required payout.
Grantmaking
Donor Advised Funds are required to give to 501(c)(3) public charities. Therefore, they are not able to make grants to private foundations or individuals, such as for scholarships or hardships. They also may not make grants to fulfill multiyear pledges. The DAF sponsoring organization handles the due diligence related to grantmaking. The donor may request grants to specific public charities. Then, the sponsoring organization is responsible for reviewing the grant requests and must approve them before they are made.
Privacy
DAFs provide donors with the ability to make anonymous grants, providing privacy if that is desired. This can be accomplished because DAFs do not have an annual filing requirement, so names of individual donors are not disclosed to the public. In addition, a gift can be presented to the charity disclosing only the name of the sponsoring organization.
Contributions and Asset Selection
When making any gift, asset selection is an important consideration. Ideal assets to gift to a DAF are long-term appreciated securities, especially those with low basis. This is the most tax-efficient method because securities that have been held for more than one year can be donated at their fair market value and it eliminates the capital gains tax on the sale. It also maximizes the charitable dollars available because the DAF is not subject to tax.
The most common assets to gift to a DAF include cash, publicly-traded securities and mutual funds. However, some donors desire to gift complex non-cash assets, such as non-publicly-traded stock or an LLC interest. Key considerations when donating complex assets include whether the supporting organization will accept the asset, if it can be transferred and liquidated, how long the process will take, how soon liquidity is needed and how much an appraisal will cost to determine the fair market value.
Family Engagement
To engage the next generation, donors may wish to create a Legacy Plan for their DAF. Typically, donors act as the primary advisors and appoint their children or loved ones as secondary advisors. Depending on the sponsoring organization, other succession options may include dividing the DAF for individual successors, naming charities as beneficiaries to receive the remaining assets or endowing a DAF to continue making grants to designated charities for a period of time. The Legacy Plan may also include a Family Philanthropic Mission Statement. This allows donors and families to communicate charitable intent and provide guidelines for grantmaking.
Income Tax Deductions for Taxpayers who Itemize Deductions
Charitable giving is not only a generous and compassionate act, but it also can be an effective tax strategy. Donors who itemize their deductions on their income tax return may qualify for a charitable contribution deduction. The tax deduction is limited to a percentage of your AGI and contributions that exceed these limitations can be carried over in each of the next five years until used.
DAFs and private foundations are subject to different tax treatment, summarized below. In years you donate a significant portion of income to charity or have a highly appreciated asset to contribute, you may receive a larger tax benefit through the use of a DAF.

Conclusion
Part 2 of this series will discuss private foundations to further help you understand which charitable vehicle may make sense for your family.
The information contained in this report is confidential and proprietary to Oxford and is provided solely for use by Oxford clients and prospective clients. The opinions expressed are those of Oxford Financial Group, Ltd. The opinions are as of date of publication and are subject to change due to changes in the market or economic conditions and may not necessarily come to pass. The information in this presentation is for educational and illustrative purposes only and does not constitute investment, tax or legal advice. Tax and legal counsel should be engaged before taking any action. OFG-2401-35
Strong fourth quarter returns across equities and bonds secured a significant market rebound in 2023. A combination of a dovish pivot from the Fed, modest US economic growth and easing inflation pressures increased the market’s expectation of the elusive “soft landing” economic scenario – where the Fed successfully brings down inflation without a resulting US recession or a meaningful increase in the unemployment rate. This fueled positive investor sentiment and a market rally through year-end.
The S&P 500 gained 26.3% on the year, led by the high-flying “Magnificent 7” (Apple, Alphabet, Microsoft, Amazon, Meta, Tesla and Nvidia) which accounted for 60% of the total return for the index. Highlighting how impactful these handful of stocks were to the total return, the cap-weighted index outperformed an equal-weighted S&P 500 by 12% on the year, the largest gap since 1998.
A familiar story of most of the last several years, US large growth outperformed value by more than 30% in 2023 with technology and consumer discretionary sectors leading the way. Energy, utilities and consumer staples were the only major equity sectors with negative calendar year returns in the US.
US small caps (Russell 2000) gained ground on large cap stocks during Q4 but trailed for the year with a return of 16.9%. Overseas, international developed equities (MSCI EAFE) increased 18.2% and emerging markets (MSCI EM) delivered a 9.8% return.
Fixed income markets experienced a volatile path to reasonable mid-single digit 2023 returns. Interest rates drifted higher the first nine months of the year. The predominant risk for bonds at that point was the “higher for longer” scenario – a view that the Fed was going to be forced to stay on offense with respect to inflation and keep rates at elevated levels. As new economic data began to show a shift towards a cooling labor market and declining core personal consumption expenditures (the Fed’s preferred inflation metric), there was a clear change in the market beginning in the fall.
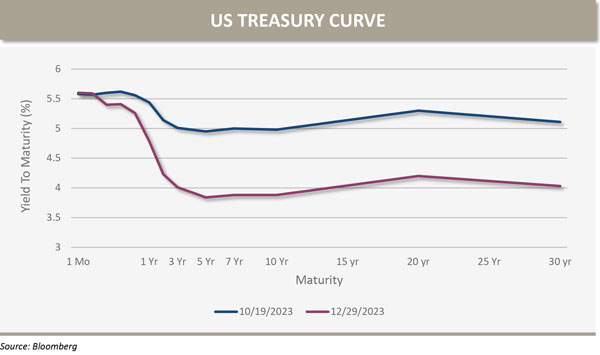
After peaking at 5.0% on October 19, the 10-year Treasury yield fell to 3.9% by year-end, nearly identical to where it started the year.

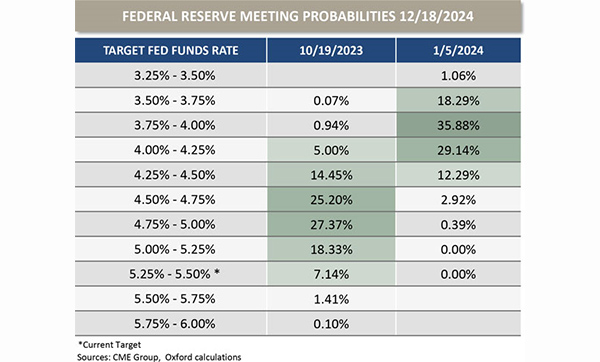
While the front end of the curve is largely unchanged over this time, the expected future path of the fed funds rate also adjusted meaningfully. The table below illustrates how futures market probabilities for the fed funds rate at the end of 2024 have evolved. The probability weighted-average fed funds rate a year from now fell from 4.79% to 3.98%.

Commodities markets struggled overall during the year. After reaching $93/barrel in early October, West Texas Intermediate (WTI) spot crude oil fell to $72/barrel by the end of December. Increases in supply from the US, which accounted for more than 50% of non-OPEC total supply growth in 2023 (according to BCA Research1) is unlikely to be repeated as the existing inventory of drilled but uncompleted wells declines.
LOOKING FORWARD
Each year countless (and mostly unpredictable) events impact markets – and 2023 was no different. From the rapid continued development of artificial intelligence (AI) and the resulting promising implications for corporate profits and efficiency to the regional bank crisis and everything in between, these events shape investor sentiment and argue against the relevance of annual market projections. To that point, according to BCA Research, 2023 was the first time in more than 25 years the average Wall Street strategist predicted a negative return from the S&P 500,1 which was not even close.
It is easy to look back and identify the specific catalysts impacting market sentiment and trends in prices. Attempting to predict these sudden changes for profit is a different matter entirely – and one that Oxford does not attempt to predict. As always, we seek to build resilient portfolios that are flexible enough to take advantage of areas of opportunity informed by our view of long-term value, which will often run counter to the market’s rearview mirror.
With that perspective as a backdrop, below is a summary of current observations as we look forward:
I. Priced to Soft Landing Perfection: The increase in equity valuations and sudden drop in interest rates indicates the market is now expecting the soft landing to occur. While that might ultimately be the case, any evidence pointing to a hard landing (recession), or no landing (re-acceleration of inflation) could lead to additional volatility in both equity and bond markets. Take advantage of recent equity market strength to rebalance to long-term strategic allocation targets.
II. Mean Reversion Opportunities: In identifying areas of opportunity, Oxford operates under a belief that valuations serve as a long-term gravitational pull on market prices. This implies a willingness to go against market sentiment, which requires patience and resolve. US small cap, natural resources, international equities and value-over-growth in US equities are all compelling from a valuation perspective relative to history.
III. Stock/Bond correlation: Periods of elevated inflation have typically been associated with a positive correlation between stocks and bonds. This means diversification benefits of a traditional stock/bond portfolio can be challenged during these times. A well-constructed allocation of Diversifier Strategies can be an excellent tool to maintain proper diversification in the current environment.
On behalf of the entire Oxford Investment Management Group, we wish you all a happy and prosperous 2024.
1https://www.bcaresearch.com/
The information contained in this report is confidential and proprietary to Oxford and is provided solely for use by Oxford clients and prospective clients. The opinions expressed are those of Oxford Financial Group, Ltd. The opinions are as of date of publication and are subject to change due to changes in the market or economic conditions and may not necessarily come to pass. The information in this presentation is for educational and illustrative purposes only and does not constitute investment, tax or legal advice. Tax and legal counsel should be engaged before taking any action. OFG-2401-19
Famed American economist and Nobel Laureate Milton Friedman often said that monetary policy works with “long and variable lags.” Conventional wisdom is that the effects of monetary tightening are most acutely felt 12-18 months after the start of a central bank rate hiking cycle. We are now in month 17 of the current hiking cycle and inflation appears set to reaccelerate in the coming months. What gives? Has monetary policy lost some of its efficacy?
The idea of fiscal dominance suggests that the answer may be “yes.” This article attempts to introduce the concept of fiscal dominance, why the 2020s may differ from previous rate cycles and what it all may mean for investors.
Fiscal Dominance
Fiscal dominance is an economic condition that occurs when a country’s debt and deficit levels are sufficiently high that monetary policy ceases to be an effective tool for controlling inflation. In fact, persistently high interest rates in an environment of perpetually large deficits actually risks exacerbating inflation.
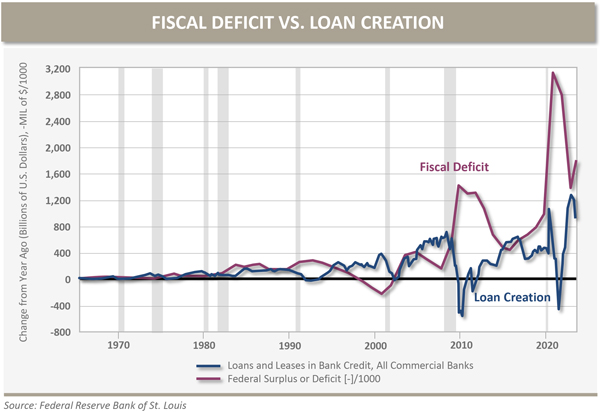
To understand the concept of fiscal dominance, it makes sense to revisit how money gets created in the first place. The two main drivers of money creation are:
Higher policy rates are effective at curtailing bank credit, which has a disinflationary cooling effect on the economy. However, higher policy rates increases debt service costs leading to a rise in government deficits, which triggers the need for further inflationary “printing.” If the source of inflation is more deficit-driven, then higher interest rates won’t solve the problem.
Why the 2020s May Differ from Previous Rate Cycles
The recent bout of inflation is primarily attributable to deficit-driven fiscal stimulus post-COVID, which has far outweighed bank credit creation in recent years. This means that the core problem is the deficit, and the Fed is using their 1970s playbook to fight a 1940s problem. Said more explicitly, higher rates might be compounding the inflation problem this time around.

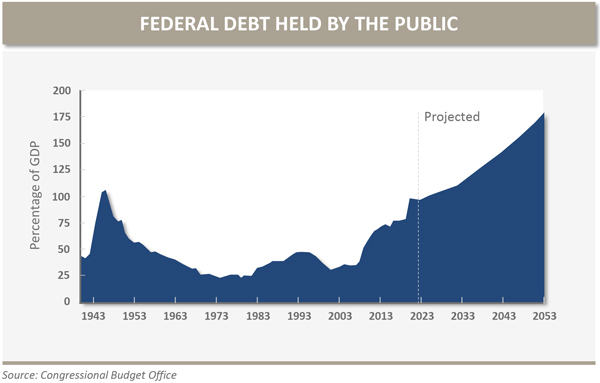
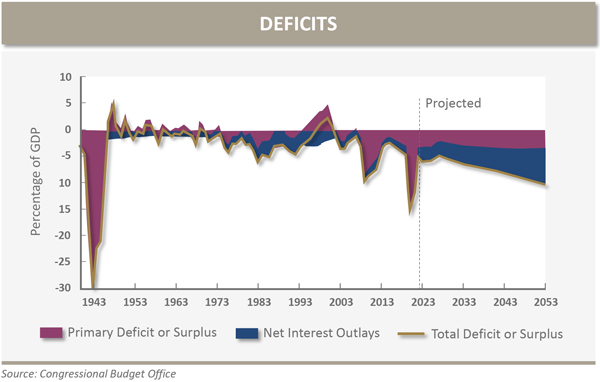
Monetary history is littered with examples of countries that experienced deficit-driven inflationary spirals with Argentina being the canonical case. Government debt exceeding 100% of GDP appears to be the point at which the efficacy of monetary policy degrades and fiscal policy begins to dominate inflationary outcomes. As of this writing the US debt-to-GDP ratio stands at 119%, and never before has our fiscal deficit been so high at a time of such low unemployment. With cuts to entitlement spending being the ultimate third-rail of politics, the deficit seems destined to expand further should the economy weaken causing social safety nets to kick in at a time of reduced tax revenues. The below charts from the Congressional Budget Office visually show some concerning projections.


The saving grace thus far for the US has been the dollar’s role as the primary reserve currency of the world. However, recent geopolitical events suggest that the dollar’s reign may be set to gradually erode as major commodity-producing nations seek to establish trade in alternative currencies. Regardless, the external demand for US Treasurys is likely to be insufficient to fund the government, meaning monetized deficit spending will be with us for the foreseeable future.
What it All May Mean for Investors
I commend anyone that has made it this far on such a wonky topic. Now the payoff: what might all this mean for investors, particularly stewards of multigenerational wealth? History suggests that US investors are likely to experience persistently above-target inflation, more pronounced cycles of inflation and stagnation and higher currency volatility than we’ve become accustomed to. History also suggests that policymakers will attempt to assuage the problem by managing the yield curve, thus subjecting investors to negative real rates of interest, sometimes referred to as “financial repression.”
The Oxford Investment Fellows℠, informed by a deep appreciation of global market history, have considered the above in our approach to portfolio construction on behalf of our clients. We strive to build robust investment portfolios capable of preserving real wealth regardless of the vicissitudes of any given market. Specifically, the current situation, as much as ever, warrants inclusion of equity investments in high quality businesses with strong moats and pricing power (both public and private). A potential secular decline in the US Dollar strongly supports diversifying equity holdings internationally as well. A pro-inflationary environment also demands investing capital in real assets such as real estate, commodities and commodity producers and neutral reserve assets such as gold. A prolonged period of financial repression significantly dampens the appeal of traditional “safety” assets, such as Treasury bonds, requiring investors to seek alternative forms of portfolio ballast. Such alternatives might include Diversifier Strategies which stand to benefit from elevated volatility and may offer a valuable source of countercyclical liquidity.
When debt levels and deficits approach the point of no return, the familiar policy playbook may no longer apply. In a condition of fiscal dominance, stewards of capital are right to turn to history for guidance and take a fresh look at their portfolios.
The information in this presentation is for educational and illustrative purposes only and does not constitute tax, legal or investment advice. Tax and legal counsel should be engaged before taking any action. Oxford Financial Group, Ltd. is an investment advisor registered with the U.S. Securities and Exchange Commission. Registration does not imply a certain level of skill or training. More information about Oxford Financial Group’s investment advisory services can be found in its Form ADV Part 2, which is available upon request. The above commentary represents the opinions of the author as of 8.9.23 and are subject to change at any time due to market or economic conditions or other factors. The information above is for educational and illustrative purposes only and does not constitute investment, tax or legal advice. No offers to sell, nor solicitation of offers to buy any securities are made hereby. Solicitations of investments and any offers to sell securities, if any, will be made only through an offering document clearly identified as such. Certain of the statements in this document are forward‐looking which cannot be guaranteed. These statements are based on current views and assumptions and involve known and unknown risks and uncertainties that could cause actual results or future performance to differ materially from those expressed or implied in such statements.OFG-2306-12
Private equity (PE) is a difficult asset class to benchmark, but by every available measurement it has produced excellent returns over long periods of time. The most recently available Cambridge Associates LLC U.S. Private Equity Index as of December 31, 2022 shows a 10-year pooled horizon Net IRR of 17.23% and a 15.29% Net IRR over 20 years. This has significantly outpaced the public market equivalent returns of the various public indexes, for example:
The gap between public and private equity performance, as shown in the chart below, may narrow at times such as during the most recent bull market. However, the public markets are rarely able to keep pace for long.

Private equity firms need to maintain this outperformance or else their investor base would soon shift to more liquid, lower cost investment options. The challenge has only increased as more capital has flooded private markets and driven up the price of private companies. But private equity firms have transformed themselves over time to meet this challenge.
Components of PE Performance
At the most basic level there are three ways to increase the value of a portfolio company investment:
1. Use leverage at acquisition and then use free cash flow to pay down debt over time and thereby increase the value of the equity
2. Grow the company’s revenue and earnings
3. Increase the multiple of earnings that the next buyer is willing to pay
Today the old stereotype that PE is just about financial engineering through excessive leverage is mostly a memory. To be sure, leverage is still part of most buyout transactions and PE firms continue to utilize it with varying degrees of prudence. But you can’t outperform in today’s market through financial engineering alone1. The best performing PE firms focus on #2 and #3. Achieving multiple expansion is an unpredictable process, but there are certain inflection points where buyers will often pay more. Successful PE firms find that they can hit these inflection points using a repeatable playbook to grow and scale a company while upgrading its infrastructure and processes.
Today PE succeeds through a combination of financial, governance and operational improvements. On the financial side, this starts with negotiating better terms with lenders and suppliers. But more importantly, PE firms unlock capital investment that a concentrated founder is unable or unwilling to do on their own. This capital makes it possible to accelerate both organic and inorganic growth.
Governance is a key area of professionalization for most portfolio companies. PE firms augment and upgrade management teams, build out an experienced board of directors and establish sophisticated financial reporting systems & processes so that management and the board are governing by data instead of by feel. Establishing an annual budgeting process and monthly key performance indicators increases accountability and allows the board to prioritize value creation projects. Effective governance lets a company make measurable progress towards key priorities and go from one success to another.
For many years PE firms could achieve success with financial and governance transformation alone. But as the market has become more competitive, today it takes more. Operational improvement is the biggest change in the PE world over the past twenty years. PE firms are becoming more specialized with specific end-markets or business models. PE firms today bring significant operational and strategic resources (both internal and external) to bear on their companies, and they get them involved earlier in the process. Where it was once sufficient to buy a company and then take 6 to 12 months taking stock of what they had, today it is a critical to hit the ground running. The integration of operational resources into investment deal teams provides more actionable opportunities for growth.
Financial, governance and operational levers are being used at all levels of private equity, but they are most compelling in the middle market and lower middle market. At Oxford we focus on lower middle market PE firms because there is more opportunity to impact transformational change in these areas at smaller businesses. While no company is completely immune to market headwinds, note that many of these improvements can still be executed despite broader macroeconomic conditions. The long term outperformance of private equity is a result of this systematic business building.
1Historically so-called “Leveraged” Buyout Transactions were financed with anywhere from 60 to 90 percent debt. As late as 2007, prior to the Global Financial Crisis, the average debt to capitalization ratio for U.S. buyout transactions was 68%. However since that time the ratio has generally been below 60% and in recent years has stayed in the mid-50s. See Kaplan & Stromberg, “Leveraged Buyouts and Private Equity,” Working Paper 14207, National Bureau of Economic Research, July 2008 and McKinsey Global Private Markets Review, 2021 and 2023.
The information in this presentation is for educational and illustrative purposes only and does not constitute tax, legal or investment advice. Tax and legal counsel should be engaged before taking any action. The information in this presentation is for educational and illustrative purposes only and does not constitute tax, legal or investment advice. Tax and legal counsel should be engaged before taking any action. OFG-2212-13 Oxford Financial Group, Ltd. is an investment advisor registered with the U.S. Securities and Exchange Commission. Registration does not imply a certain level of skill or training. More information about Oxford Financial Group’s investment advisory services can be found in its Form ADV Part 2, which is available upon request. The above commentary represents the opinions of the author as of 1.12.23 and are subject to change at any time due to market or economic conditions or other factors. The information above is for educational and illustrative purposes only and does not constitute investment, tax or legal advice. No offers to sell, nor solicitation of offers to buy any securities are made hereby. Solicitations of investments and any offers to sell securities, if any, will be made only through an offering document clearly identified as such. Certain of the statements in this document are forward‐looking which cannot be guaranteed. These statements are based on current views and assumptions and involve known and unknown risks and uncertainties that could cause actual results or future performance to differ materially from those expressed or implied in such statements. OFG-2306-12
**As of 12.1.21
***As of 8.1.22
by: Tyler Rosser, JD.
Wealth Strategist
Death and Taxes…as vexing to confront as they are certain to occur. In this area, we should heed the advice of Winston Churchill, who suggested that we “let our advance worrying become advance thinking and planning.”
Advance thinking and planning in the fields of life insurance and estate tax planning, although important for everyone, are even more essential and nuanced for those facing a taxable estate. The looming 40% estate tax presents a myriad of planning opportunities to transfer wealth outside of the taxable estate.
This e.Insight explores how using an Irrevocable Life Insurance Trust (ILIT) can provide significant relief from estate tax liability and allow a greater percentage of a decedent’s wealth to pass to the intended beneficiaries.
Irrevocable Life Insurance Trust (ILIT) Overview
An ILIT is an irrevocable trust that is primarily designed to serve as the owner and beneficiary of one or more life insurance policies insuring the life of the grantor. The primary advantage of utilizing an ILIT is the removal of the death benefit from the grantor’s gross estate. A life insurance death benefit only has a 60% effective realization rate when subject to estate tax, and if exemption amounts are reduced by one-half in December 2025 as anticipated, a greater percentage of estates will shift towards the taxable category1. If more estates become subject to estate tax, the ILIT will likely become an even more prevalent strategy for tax-efficient life insurance planning.
In addition to estate tax savings benefits, ILITs provide asset protection advantages by shielding assets from the creditors of the ILIT beneficiaries and the creditors of the grantor. By paying the death benefit into the trust as opposed to outright to the beneficiaries, an ILIT allows a grantor to stipulate how and when the life insurance death benefit is distributed to beneficiaries. This allows the grantor to secure asset protection for children, grandchildren and future generations.
An ILIT may also be designed so that the proceeds from any life insurance policy are made available as a source of liquidity to pay any estate tax owed. Funding estate tax liability upon death is a common concern for closely held business owners who have a significant portion of their wealth concentrated in illiquid, closely held business interests. Utilizing an ILIT strategy can prevent the estate of a deceased business owner from being forced to liquidate closely held business interests to pay estate tax.
To escape estate tax under an ILIT strategy, the grantor cannot have an “incident of ownership” (as defined in I.R.C. § 2042) over the life insurance policy such that the proceeds of the policy are subject to a power of disposition by the grantor2. In essence, the grantor must relinquish control over the life insurance policy for it to be excluded from the gross estate.
ILIT Premium Funding
A primary consideration and potential challenge to the implementation of a successful ILIT strategy is determining how to fund the annual premium payments. Because the primary (and oftentimes sole) asset of an ILIT is a life insurance policy, many ILITs lack adequate liquid assets to make the annual premium payment. The grantor cannot simply make the annual premium payments on behalf of the ILIT, because to do so would trigger gift tax consequences. The federal gift tax, which also has a rate of 40%, works in tandem with the federal estate tax to prevent the shifting of wealth during life in an attempt to avoid estate tax at death.
Based on factors such as the size of the annual premium payment, the grantor’s liquidity position, the grantor’s remaining gift and estate tax exemption and the specific terms of the ILIT, one or more of the following strategies may be ideal to fund premium payments.
I. Annual Exclusion Gifting (Crummey Withdrawal Rights)
A widely-used strategy to fund premium payments involves the grantor transferring cash to the ILIT and using the annual exclusion to avoid making a taxable gift. In 2023, the annual exclusion amount is $17,000 per recipient. If the grantor’s spouse is not a trust beneficiary, the grantor’s spouse may also gift this amount per recipient to the ILIT. The amount of the premium payment and the number of ILIT beneficiaries will determine whether annual exclusion gifting will satisfy the premium funding requirement.
For example, consider an ILIT that has eight current beneficiaries (grantor’s spouse is not a beneficiary) and annual premium payments owed totaling $250,000. The total amount of annual exclusion gifting available to these recipients by grantor and grantor’s spouse equals $272,000 ($17,000 x 2 x 8). Because the total amount of annual exclusion gifting available to the ILIT exceeds the premium payment owed, the grantor (with the participation of grantor’s spouse) can satisfy the premium payment through annual exclusion gifting to the ILIT and thereby avoid making a taxable gift.
For a gift to qualify for the annual exclusion, the gift must be a present interest gift3. On its face, a grantor’s contribution of cash to an ILIT for the purpose of paying the premium is not a present interest gift to the beneficiary recipients; rather, it is a future interest gift against which no annual exclusion is allowed. However, through the use of Crummey Withdrawal Rights, the gift to the ILIT can be transformed into a present interest gift that qualifies for the annual exclusion.
Crummey Withdrawal Rights (also called Crummey Powers) give the beneficiary a limited time to withdraw contributions made to a trust in order to make the contribution to the trust a present interest gift4. When a contribution is made to the trust, the trustee will send out a Crummey Notice to each beneficiary stating the right to withdrawal the beneficiary’s proportional amount of the contribution. The right to withdrawal should remain open for a period of at least 30 days to give the beneficiary a meaningful time to exercise. Upon expiration of the withdrawal period, the right to withdrawal lapses. While a grantor or trustee may not prohibit a beneficiary from exercising a withdrawal right, the presumption with this strategy is that beneficiaries will not exercise the right to withdrawal and the grantor’s contribution to the trust will be used to fund the premium payment.
II. Lifetime Exemption Utilization
If a grantor’s available annual exclusion gifting amount is inadequate to cover the entire premium, a portion of the grantor’s lifetime exemption can be applied to fund the difference. If the above example is modified such that the annual premium payments total $400,000 (increased from $250,000) and the beneficiary and annual exclusion assumptions remain constant ($272,000 of annual exclusion availability), the grantor could annually use $128,000 of lifetime exemption to cover the difference. Depending upon the size of the grantor’s estate, the grantor’s remaining exemption and additional estate planning strategies that have or will be implemented, this may or may not be an optimal strategy to fund the premium.
III. Premium Financing
It is common for the annual premium of a substantial life insurance policy to exceed the grantor’s annual exclusion, remaining estate tax exemption or available liquidity. Additionally, a grantor may not wish to utilize cash to fund ILIT insurance premiums if doing so would have a high opportunity cost (i.e., if the cash required for the premium could be invested elsewhere earning a higher rate of return). When these considerations are present, premium financing may be an attractive option.
The loan ultimately must to be repaid. Oftentimes, the loan will be repaid from the built-up cash value of the life insurance policy, the death benefit proceeds, monetization of a separate illiquid asset held by the trust (such as closely-held business interests or real estate) or a subsequent lifetime exemption gift by the grantor. Another common approach is to systematically transfer liquid assets to the ILIT over time through related wealth transfer strategies such as grantor-retained annuity trusts (GRATs) that avoid gift and estate tax inclusion. The remainder interest from a series of GRATs can be used to provide the ILIT with liquidity to pay all or part of the principal balance of the third-party loan.
Conclusion
While death and taxes might be life’s certainties, advance planning allows for optimization of outcomes. The difference in outcomes between an estate that has engaged in advance planning and one that has not can be so significant that classifying estate taxes as a “certainty” begins to feel like a misnomer. ILITs can be an excellent strategy for the mitigation and funding of federal estate tax, the protection and preservation of assets and the enhanced transfer of wealth to future generations; these strategies are most effective when carefully considered and planned in advance. Your Oxford team is well positioned to ensure that your plan is optimized for life’s “certainties” and that you have developed an optimal estate and wealth transfer strategy.
1The gift and estate tax exemption and the GST exemption are $12,920,000 in 2023. The exemptions are slated to return to $5,000,000 (indexed for inflation) as of December 31, 2025, unless modified or extended by Congress.
2See I.R.C. § 2042.
326 C.F.R § 25.2503-3 defines “present interest” as an “unrestricted right to the immediate use, possession, or enjoyment of property or the income from property.”
4See Crummey v. Commissioner, 397 F.2d. 82 (9th Cir. 1968).
The information in this presentation is for educational and illustrative purposes only and does not constitute tax, legal or investment advice. Tax and legal counsel should be engaged before taking any action. OFG-2303-25
Recap of March 10
As I am sure all of you are aware at this point, on Friday, March 10, 2023, the California Department of Financial Protection and Innovation (DFPI) took possession of Silicon Valley Bank (SVB), citing inadequate liquidity and insolvency. The DFPI appointed the Federal Deposit Insurance Corporation (FDIC) as receiver of SVB, and the FDIC in turn created the Deposit Insurance National Bank of Santa Clara, which now holds the insured deposits from SVB. Over the course of last weekend regulators moved swiftly and took two major actions to try and contain any potential contagion: (1) they provided a guarantee to cover all deposits at SVB; and Signature Bank and (2) they put in place the Bank Term Funding Program, a generous new short-term lending facility.
Weakness in other regional banks
Although these actions certainly provided confidence to the system heading into Monday morning, March 13, investor fears the latter half of the week caused weakness in other regional banks. First Republic lost a fifth of its market share after S&P Global Ratings downgraded its credit rating to “junk.” It subsequently took a $30 billion investment from a syndicate of eleven major banks, including JPMorgan Chase, Bank of America, Wells Fargo, Citigroup and Truist. Given the difference in balance sheets between SVB and First Republic, this shows just how fragile the banking system can be when it comes to issues of consumer confidence.
We saw more action in the banking world this past weekend with the announcement that UBS would purchase Credit Suisse for $3.2 billion. This came at the urging of regulators and required the Swiss government to provide more than $9 billion to backstop losses that UBS may incur in taking over Credit Suisse. The Swiss National Bank is providing more than $100 billion of liquidity to UBS to help facilitate the transaction.
What questions does all of this have us asking?
After the precipitous demise of SVB and Signature Bank over the weekend followed by the swift action of regulators to try and stem the tide of contagion, we are left with a number of questions about what the knock on effects might be.
I. Has the Fed done enough to stem the tide of contagion?
The Fed has taken two major policy actions: (1) A guarantee covering all deposits of SVB and Signature Bank; and (2) put in place the Bank Term Funding Program, a generous new short-term lending facility. Although there was some positive market response with regional bank stocks market value improving early in the week, in situations like these it is never quite clear whether enough has been done. This became clear as the market value of many of the regional banks rode a roller coaster the rest of the week with First Republic even taking a $30 billion investment from eleven major banks. The collapse of SVB and Signature Bank caused a stunning shift in market expectations around Fed policy towards interest rates, but a strong core CPI reading for February this week was a reminder that the inflation issue remains front and center. Either way, it appears as though risks to increasing US interest rates have shifted to the downside.
II. What is the magnitude of unrealized losses on banks’ balance sheets throughout the system?
Higher interest rates caused a loss in value of SVB’s securities portfolio, which is a headwind faced by all banks. 450 basis points of rate hikes in a 12-month period drove $620 billion of unrealized losses on US bank balance sheets at the end of 2022. We have already seen a small erosion of core capital ratios due to unrealized losses on available for sale securities accumulated during the past year. Looking at the ~60 largest banks, we see that the CET1 capital ratio fell from 13.4% to 12.9% of risk weighted assets over the course of 2022. This seemingly still leaves banks a decent enough capital buffer to withstand further falls in value. However, what happens if the emergency liquidity facility provided by central banks proves to be insufficient and banks need to realize losses on their held to maturity securities in order to make good on their liabilities? This would compound losses and bring banks’ solvency into question.
III. What is the risk of contagion to other domestic banks or other economies?
The main channel of contagion to both US banks and other economies is a loss of confidence in the system as a whole. It is difficult to predict if and when this will happen. There are a few items that give us some comfort that we might avoid it. First, the collapses of SVB and Signature Bank were due to seemingly idiosyncratic issues, large unhedged interest rate risk and large exposures to cryptocurrency, respectively. Other major banks and large regionals have a lower level of balance sheet exposure.
Source: BCA Research
Second, SVB was not subject to the Fed’s stress tests, which might have clamped down on its behaviors (maybe). Our hesitation on this point stems from the fact that the Fed had spotted issues at SVB, noting that it was using an incorrect model to evaluate interest rate risk and keeping it under supervisory review for much of 2022. In the Eurozone, the European Banking Authority takes a more expansive approach, conducting stress tests on 70 European banks covering 70% of EU banking assets. The question is whether or not the regulators would be able to do anything to correct bad behavior before markets identify it and react.
Third, and likely most important, central banks have several tools to manage contagion risks caused by problems on the liability side of banks’ balance sheets. That is, bank runs or a freezing within funding markets. We saw two of these tools employed in this scenario: (1) the expansion of deposit insurance; and (2) the extension of lending windows. This is notably different from situations involving a crisis driven by an increase in credit risk (e.g., the collapse of Lehman Brothers).
Nevertheless, there is the very real possibility that given how interconnected our financial system is, other follow-on issues will emerge that are not front and center today. Also, given how dependent our banking system is on consumer confidence, any serious degradation in consumers’ confidence that banks can meet deposit demands will have swift, negative consequences for banks (e.g., First Republic) and will likely ripple through the rest of the US and potentially, the global economy.
IV. How will other central banks respond?
For the time being it is likely that central banks will continue on their independent hiking paths as they continue to fight inflation. The European Central Bank (ECB) went ahead with its pre-announced intention and increased the deposit rate by 50 basis points last week. The Bank of England is set to raise the Bank Rate by 25 basis points this coming week.
We only need to look back to the 1999/2000 dotcom crash as a reminder that other central banks do not have to follow the Fed in lockstep when the severity of a crisis differs from country to country. During that time, while all major central banks cut interest rates, the 475 basis point cut in the US dwarfed the 150 basis point cut in the Eurozone and the 200 basis point cut in the United Kingdom.
Although it is likely (and reasonable) that the various central banks will continue down independent paths with regard to interest rate policy and inflation battles, we have started to see coordinated central bank action on the liquidity front in order to ease strains in global funding markets and dampen the effects on the supply of credit to households and businesses. Over the weekend, The Bank of Canada, the Bank of England, the Bank of Japan, the ECB, the Federal Reserve and the Swiss National Bank announced a coordinated action to enhance the provision of liquidity via the standing US dollar liquidity swap line arrangements. According to a press release by the Board of Governors of the Federal Reserve System, “To improve the swap lines’ effectiveness in providing U.S. dollar funding, the central banks currently offering U.S. dollar operations have agreed to increase the frequency of 7-day maturity operations from weekly to daily.”
The worst case scenario is that the problems are not confined to the US banking system and are more widespread through the broader US or global economy. This more widespread scenario could be because of similar problems to SVB or, more likely, because SVB, Signature Bank, First Republic and Credit Suisse are an early indication of other unknown vulnerabilities hiding in the financial sector.
Conclusion
The specific issues leading to the collapse of SVB and Signature Bank appear to be more acute at those institutions. However, if depositors started to fear the certainty of their deposits, as they did with SVB, policymakers would likely need to take quick action to insure those deposits, stem the outflow of capital and prevent more banks from selling assets and realizing losses. While the most likely scenario is probably something between the problems being confined to a sub segment of the US banking system on the one hand and the broader US economy on the other, there is a tail risk scenario where the collapse of SVB marks the start of a broader global financial crisis. Said more simply, the US economy is likely to feel some lasting effects, which will affect the path of US monetary policy with a left-tail possibility that the knock-on impact is not contained to the United States and will be felt more broadly throughout the global financial system.
Oxford Financial Group, Ltd. is an investment advisor registered with the U.S. Securities and Exchange Commission. Registration does not imply a certain level of skill or training. More information about Oxford Financial Group’s investment advisory services can be found in its Form ADV Part 2, which is available upon request. The above commentary represents the opinions of the author as of 3.20.23 and are subject to change at any time due to market or economic conditions or other factors. The information above is for educational and illustrative purposes only and does not constitute investment, tax or legal advice. No offers to sell, nor solicitation of offers to buy any securities are made hereby. Solicitations of investments and any offers to sell securities, if any, will be made only through an offering document clearly identified as such. Certain of the statements in this document are forward‐looking which cannot be guaranteed. These statements are based on current views and assumptions and involve known and unknown risks and uncertainties that could cause actual results or future performance to differ materially from those expressed or implied in such statements. The information in this presentation is for educational and illustrative purposes only and does not constitute tax, legal or investment advice. Tax and legal counsel should be engaged before taking any action. Read the disclaimers. OFG-2303-09
As I am sure all of you are aware at this point, on Friday, March 10, 2023, the California Department of Financial Protection and Innovation took possession of Silicon Valley Bank, citing inadequate liquidity and insolvency. The Department of Financial Protection and Innovation appointed the Federal Deposit Insurance Corporation as receiver of Silicon Valley Bank, and the Federal Deposit Insurance Corporation in turn created the Deposit Insurance National Bank of Santa Clara, which now holds the insured deposits from Silicon Valley Bank. Given Silicon Valley Bank’s prominent position in the technology ecosystem, this began causing ripples throughout the industry.
Over the weekend regulators moved swiftly to try and contain any potential contagion. According to the Federal Deposit Insurance Corporation, insured Silicon Valley Bank depositors had access to their funds Monday morning. In a joint statement from Treasury Secretary Janet Yellen, Federal Reserve Chair Jerome Powell and Federal Deposit Insurance Corporation Chair Martin Gruenberg, federal regulators announced they would roll out emergency measures to backstop all depositors. The Federal Reserve has gone one step further and stated under a new “Bank Term Funding Program” that it is making additional funding available to banks (beyond Silicon Valley Bank) to ensure they have the ability to meet the needs of all depositors. This program will offer loans of up to one year to banks that pledge US Treasury, mortgage-backed securities and other collateral.
For perspective, Silicon Valley Bank is the sixteenth largest bank in the United States and the second largest to ever fail. Its ~$210B in assets are roughly two-thirds of Washington Mutual (not adjusting for inflation,) which failed in 2008 and is the largest bank to fail in the United States.
Similar to a hypothetical story that is used to explain exponential thinking (or threats) involving lily pads covering a pond, the pace and timing of Silicon Valley Bank’s failure can be best described as gradual then sudden. It was over the course of several years that Silicon Valley Bank’s financial position deteriorated, but just two days elapsed between its March 8 announcement that it was seeking to raise $2.5B of new capital to shore up its balance sheet and the March 10 declaration by regulators that it had failed and was being placed in receivership.
To illustrate the point, imagine a large pond that is completely empty except for a single lily pad. Assume that the lily pad will grow exponentially covering the entire pond in three years. In other words, after one month there will two lily pads, after two months there will be four, etc. The pond is covered in 36 months. When asked when the pond would be half filled with lily pads, the normal temptation (and knee jerk response) would be to say 18 months or half of the 36 months. On the contrary, in fact, the correct answer is 35 months. Merely one month (or compounding time period) before the pond is filled, it’s only half filled. This is because it doubles the next month. Although the correct answer is relatively straightforward to understand, our brains tend to work more linearly than exponentially. It is not necessarily obvious before knowing the answer that the pond is 1/64 full in month 30, only six months before it is completely full.
What Happened?
The short answer is, an old-fashioned run on the bank. The much wordier answer is that Silicon Valley Bank carved out a distinct but riskier niche than many of its competitors, which set it up for large potential capital shortfalls in a rising interest rate environment, deposit outflows and forced asset sales.
Silicon Valley Bank is known as a bank for start-ups. It would open up accounts and start a relationship with these young companies often before larger lenders would consider it. It also lent to them, something other banks are reluctant to do, and used this product as a way to get the whole banking relationship with these young companies. That is, it was not uncommon for Silicon Valley Bank to require all banking business be conducted with it in order for the company to secure a line of credit. Silicon Valley Bank had an unusually high reliance on corporate venture capital deposits. Of Silicon Valley Bank’s ~$173B of customer deposits, $~150B were uninsured (i.e., over the $250,000 Federal Deposit Insurance Corporation insurance limit) and only ~$5B were fully insured.
Between the last quarter in 2019 and the first quarter of 2022, deposits at US banks rose precipitously (by $5.4T, yes trillion with a “T”) but because of weak loan demand only 15% was lent out as traditional commercial loans. The rest was invested in securities portfolios, primarily US Treasuries and mortgage-backed securities. Silicon Valley Bank experienced this to an even greater extent. As the venture community boomed over the last handful of years so did Silicon Valley Bank’s deposit accounts, as its clients were flush with cash and needed somewhere to put it. Silicon Valley Bank’s deposits grew more than 4x from $44B at the end of 2017 to $189B at the end of 2021; however, its loan book only grew from $23B to $66B. Since the bank model is predicated on making money on the spread between the interest rate paid on deposits and the rate paid by borrowers, having a deposit base that is outsized versus a loan book causes issues. This drove Silicon Valley Bank to acquire other interest-bearing assets, or more specifically $128B worth of mortgage-backed securities and US Treasury by the end of 2021.
Banks can either designate these securities as being “available-for-sale” or “hold-to-maturity” portfolios. The primary difference being that available-for-sale portfolios are regularly marked to market and hold-to-maturity portfolios are only marked to market when a sale occurs. However, if even a portion of the hold-to-maturity portfolio is sold then the entire portfolio must be marked to market. This makes selling hold-to-maturity securities complicated because it results in larger portions of the portfolio being suddenly marked to market, which can then result in the need to raise capital. Silicon Valley Bank was one of the banks that relied heavily on hold-to-maturity treatment for its growing securities portfolio. From 2019 to the end of 2022, Silicon Valley Bank grew its available-for-sale book from $14B to $27B but grew its hold-to-maturity book from $14B to $99B.
Given its need to sell securities and what interest rates did during 2022, you can imagine what that mark to market looked like on Silicon Valley Bank’s books. At the same time, those same soaring interest rates slowed the boom in the venture capital community. This left Silicon Valley Bank uniquely exposed. Its deposits had grown significantly when interest rates were low and its clients had plenty of cash. Since the bank also made investments during this time, it purchased bonds at their peak price and lowest rates. As venture-capital fundraising dried up, Silicon Valley Bank’s clients drew down their deposits to fund operations. Deposits fell from $189B at the end of 2021 to $173B at the end of 2022. Silicon Valley Bank was forced to sell off its liquid bond portfolio at substantially lower prices than it paid. The $1.8B in losses it took on these sales left a hole and hence the need to raise $2.5B of equity capital to plug a hole in its balance sheet. When it went under on Friday, the bank held $91B of investments, valued at their cost at the end of last year.
Once word of the needed capital raise became public, depositors across the venture capital ecosystem descended upon Silicon Valley Bank like the townspeople of Bedford Falls on George Bailey’s Building and Loan. A classic run on the bank.
The information in this presentation is for educational and illustrative purposes only and does not constitute tax, legal or investment advice. Tax and legal counsel should be engaged before taking any action. Oxford Financial Group, Ltd. is an investment advisor registered with the U.S. Securities and Exchange Commission. Registration does not imply a certain level of skill or training. More information about Oxford Financial Group’s investment advisory services can be found in its Form ADV Part 2, which is available upon request. The above commentary represents the opinions of the author as of 3.14.23 and are subject to change at any time due to market or economic conditions or other factors. The information above is for educational and illustrative purposes only and does not constitute investment, tax or legal advice. No offers to sell, nor solicitation of offers to buy any securities are made hereby. Solicitations of investments and any offers to sell securities, if any, will be made only through an offering document clearly identified as such. Certain of the statements in this document are forward‐looking which cannot be guaranteed. These statements are based on current views and assumptions and involve known and unknown risks and uncertainties that could cause actual results or future performance to differ materially from those expressed or implied in such statements. OFG-2303-9
**As of 12.1.21
***As of 8.1.22
Read the disclaimers